“The Pond” analogy, refers to a pond with fresh water flowing in from the left, traveling thru the pond and exiting on right. If a property is priced/prepared/marketed well, it enters on the left, “flows” across and exits quickly to the right. Properties that are not priced/prepared/marketed well, sink to two different levels; “Show and Place” or the “Stagnant Mass”. When owners find themselves in these lower levels of the pond, changes need to be made in price/preparation/marketing to get the property back in the “Flow”, so it can be sold and exit the pond.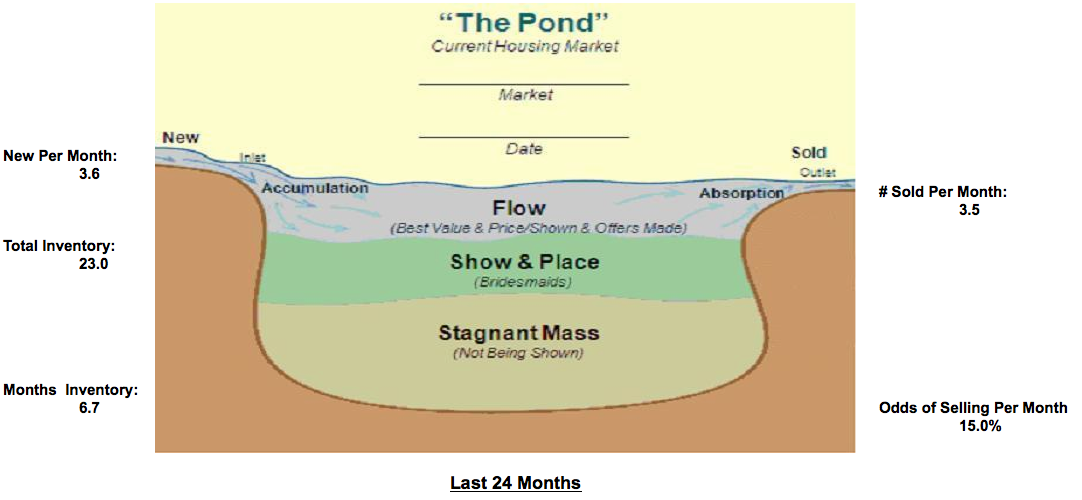
If we look at the pond chart for the past 24 months, we see that, on average, 3.6 properties come on the market each month and 3.5 properties are sold. Supply and demand and pretty balanced.
With the current inventory of 23 units for sale, that are selling at a rate of 3.5 per month, it would take 6.7 months for all the properties to sell (given no new supply coming on).
Given these numbers, a property owner has a 15% chance of selling each month.
If we look at the pond chart for the past 6 months, we see that, on average, 5 properties come on the market each month and 4.3 properties are sold. Like we saw in the “Odds of Selling” chart, supply is growing faster than demand.
With the current inventory of 23 units for sale, that are selling at a rate of 4.3 per month, it would take 5.3 months for all the properties to sell (given no new supply coming on).
Given these numbers, a property owner has a 18.8% chance of selling this month.
Leave a Reply