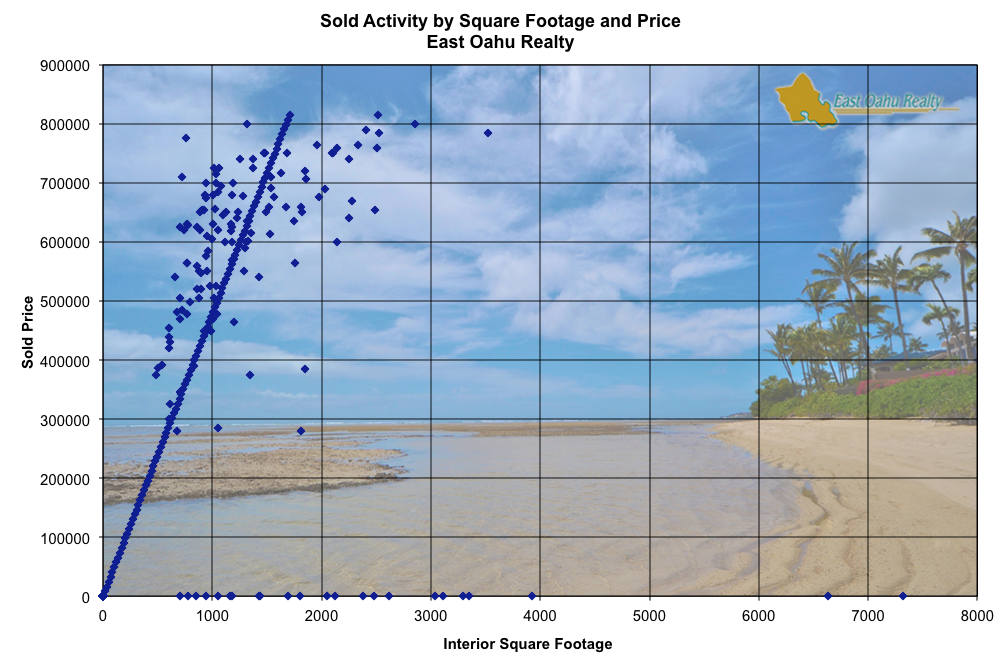
This chart shows us the relationship of price and square footage at Palolo valley
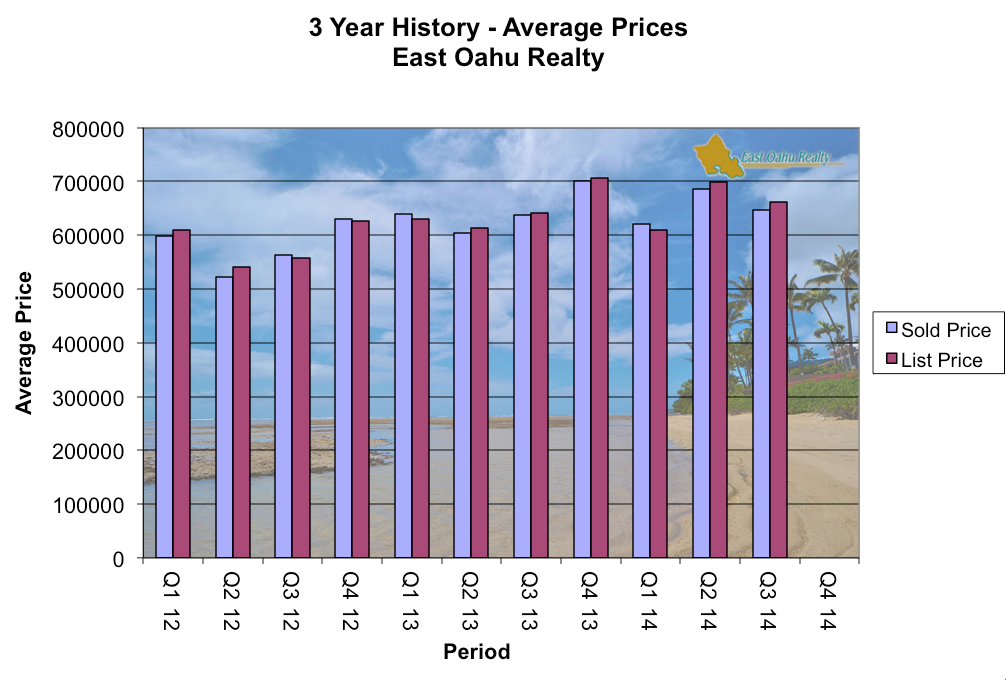
This chart represents average sales price over the past 3 years. We can see the upward trend in prices as well as the relationship between list price and sold price.
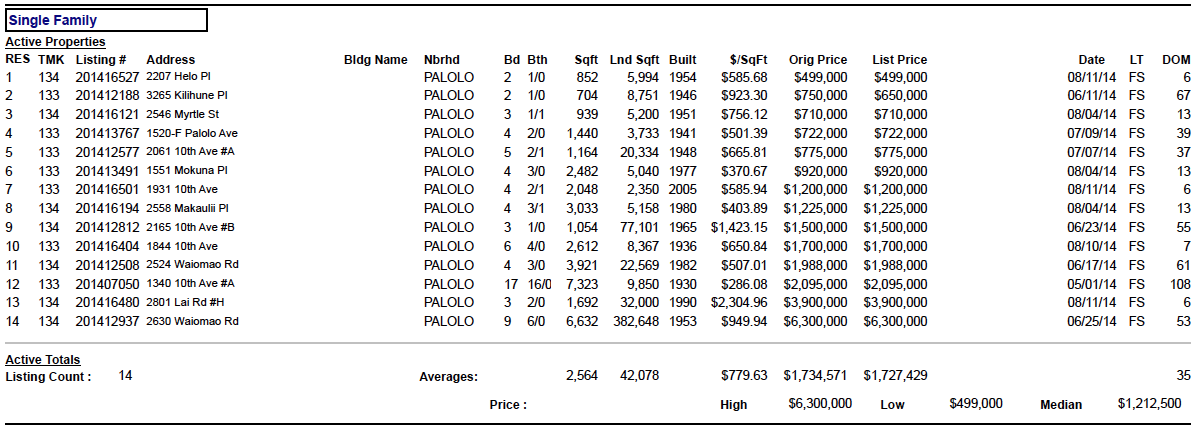
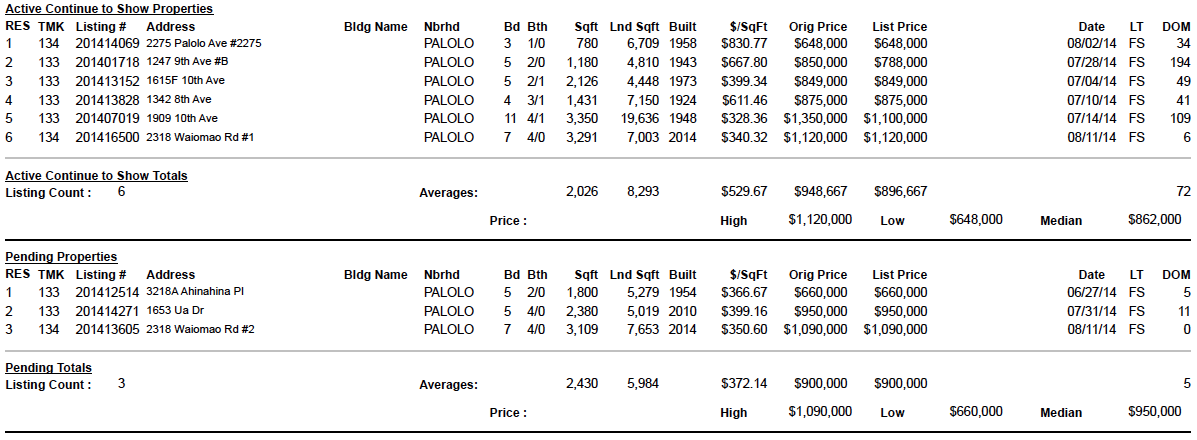
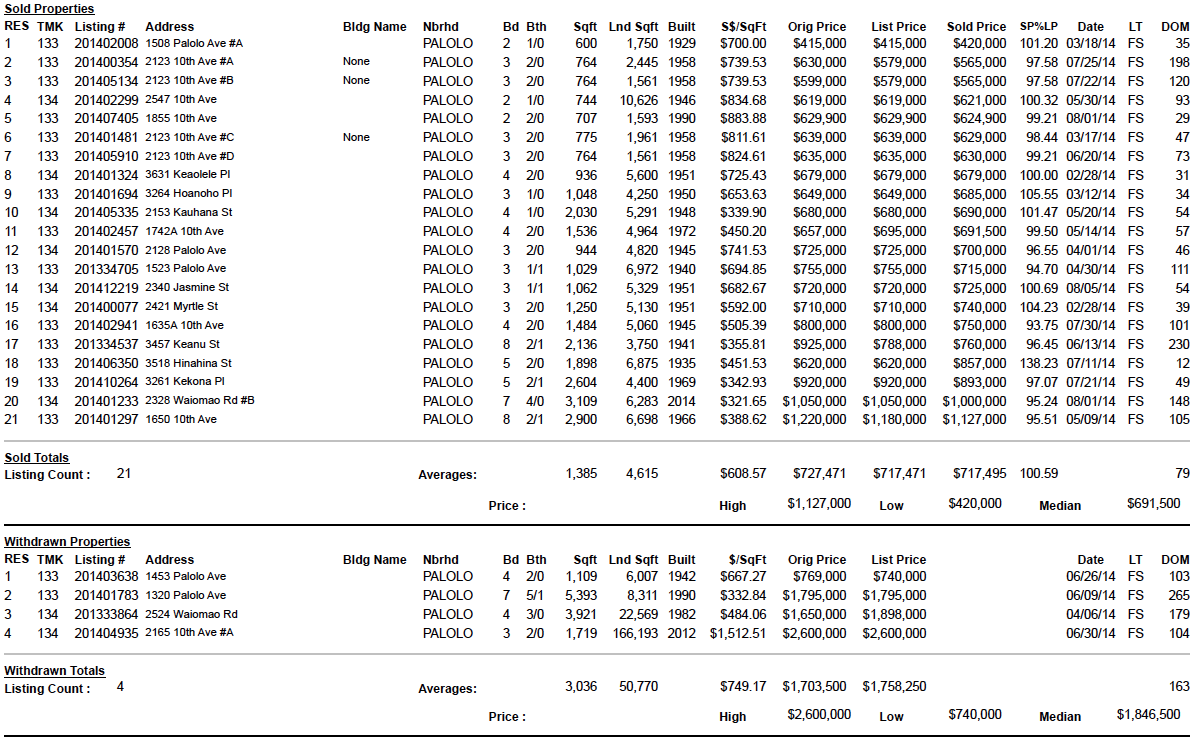
Last 6 months of data for all of Palolo Valley:


Leave a Reply